


In stock trading, the Simple Moving Average (SMA) is a widely used technical analysis tool. It calculates the average price of a security over a specified period of time by adding up the closing prices for a set number of periods and then dividing that total by the number of periods.
For example, a 50-day SMA would add up the closing prices of the last 50 days and divide that sum by 50 to get the average price. This average is plotted on a chart to smooth out price fluctuations and highlight trends over time.
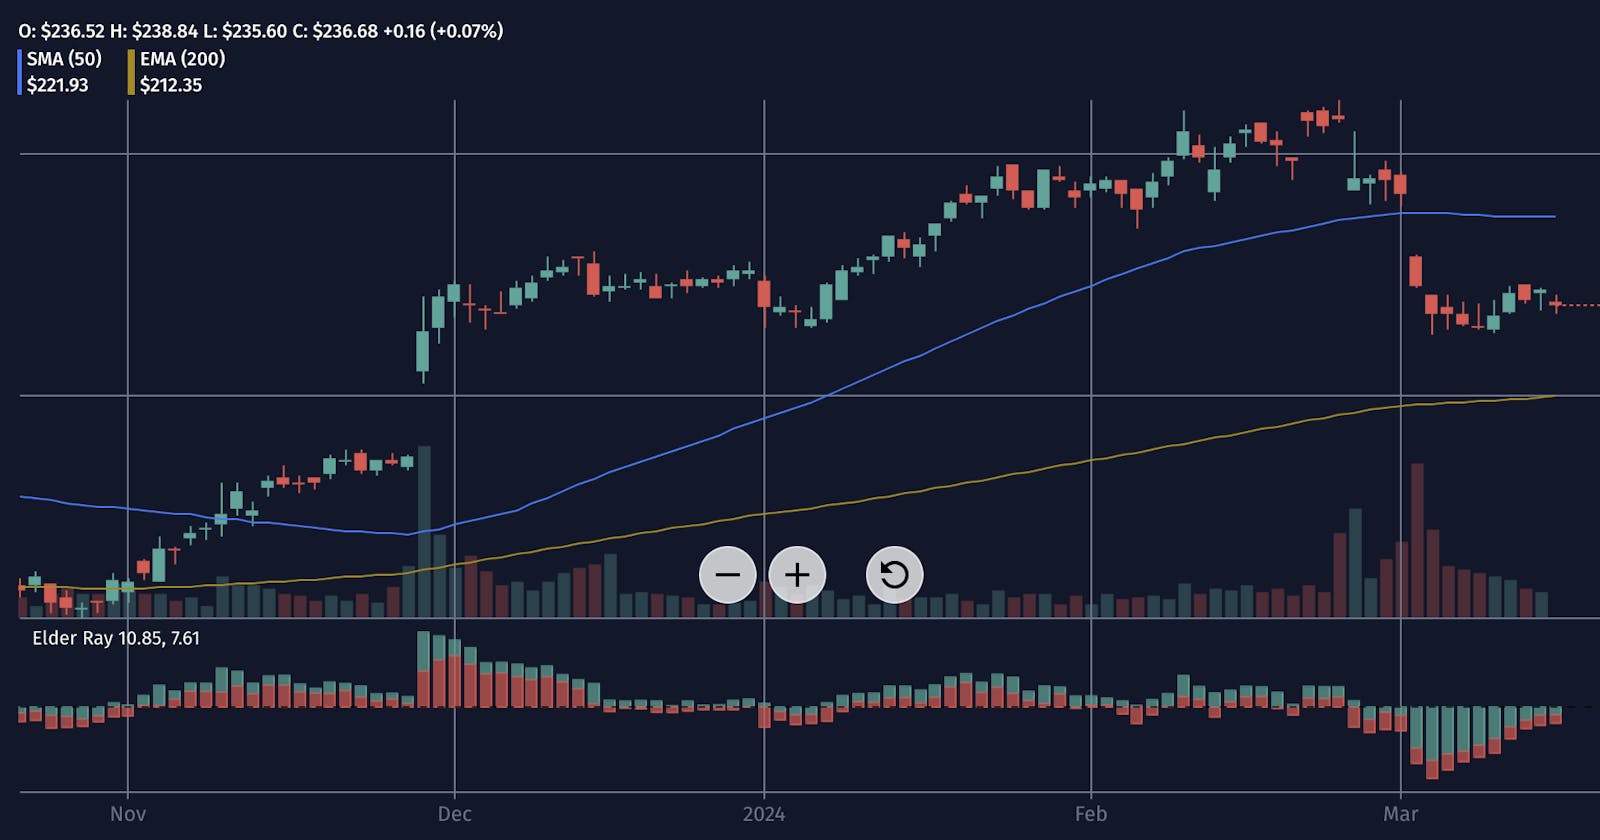
Traders often use SMAs to identify trends and potential reversal points in the market. When the price of a security crosses above its SMA, it may indicate a bullish trend, while a crossover below the SMA may suggest a bearish trend.
Shorter SMAs, like 10 or 20-day SMAs, respond more quickly to price changes and are useful for short-term trading strategies, while longer SMAs, like 50 or 200-day SMAs, provide a broader view of the market's trend and are often used in longer-term analysis.
Trading screeners allow traders to filter stocks based on various criteria, including SMA. Traders can use trading screeners to find stocks that meet specific SMA criteria, such as stocks where the current price is above or below a certain SMA, or where two SMAs have crossed over. This helps traders identify potential trading opportunities more efficiently by narrowing down the vast universe of stocks based on their SMA indicators.
Overall, the Simple Moving Average is a straightforward yet powerful tool used by traders to analyze price trends and make informed trading decisions.
How to calculate Simple Moving Average (SMA) using Pandas library in Python?
You can calculate the Simple Moving Average (SMA) using Python by utilizing libraries such as NumPy or pandas. Below is a simple example of how to calculate the SMA of a given dataset using pandas:
import pandas as pd

# Sample dataset
data = {'Date': ['2024-03-01', '2024-03-02', '2024-03-03', '2024-03-04', '2024-03-05'],
        'Close': [100, 102, 105, 103, 107]}

# Create a DataFrame
df = pd.DataFrame(data)

# Convert 'Date' column to datetime type
df['Date'] = pd.to_datetime(df['Date'])

# Calculate the Simple Moving Average (SMA) over a window of 3 days
sma_window = 3
df['SMA'] = df['Close'].rolling(window=sma_window).mean()

print(df)
Output:
        Date  Close         SMA
0 2024-03-01    100         NaN
1 2024-03-02    102         NaN
2 2024-03-03    105  102.333333
3 2024-03-04    103  103.333333
4 2024-03-05    107  105.000000
How to calculate Simple Moving Average (SMA) using NumPy library in Python?
You can calculate the Simple Moving Average (SMA) using the NumPy library in Python by leveraging its array manipulation capabilities. Here's how you can do it:
import numpy as np

# Sample dataset
prices = np.array([100, 102, 105, 103, 107])

# Calculate the Simple Moving Average (SMA) over a window of 3 days
sma_window = 3
sma = np.convolve(prices, np.ones(sma_window)/sma_window, mode='valid')

print(sma)